Stocks · Lesson 9 of 15
Chart Basics: Candlesticks, Indicators & Patterns
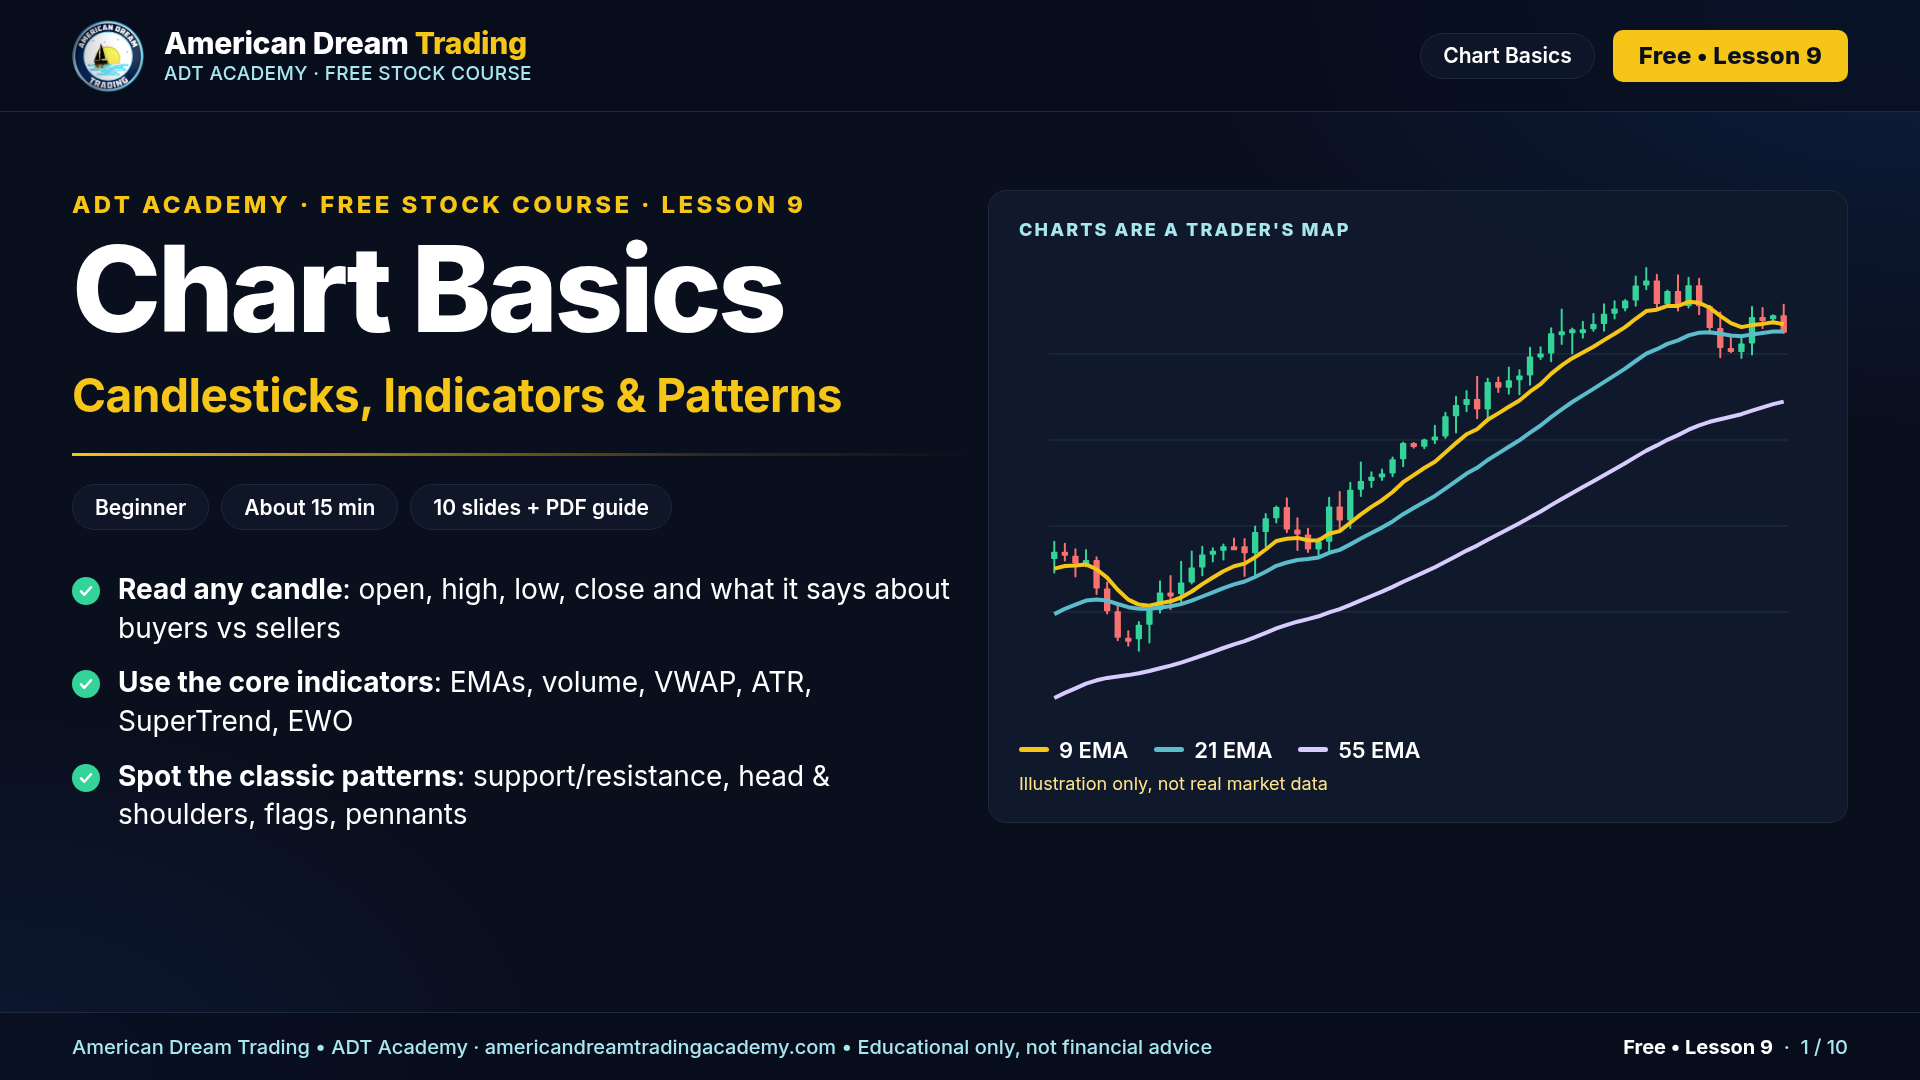
Slide 1 / 10
Level: Beginner · About 15 min · 10 slides + PDF
Charts are a trader's map. Learn to read a candlestick (open, high, low, close), the multi-candle patterns to know, ADT's core indicators (9/21/55 EMA, 200 MA, volume, VWAP, ATR, SuperTrend, EWO), the classic chart patterns, and how to put them together in a 9/21 EMA crossover setup.
🔑 Key takeaways
- Every candle shows Open, High, Low, Close for one period.
- 9 / 21 / 55 EMA + 200 MA show the trend at different speeds.
- Volume confirms. VWAP is the day's pivot. ATR sizes stops.
- EWO measures momentum. Watch for divergence.
- Patterns need confirmation. Never trade one signal alone.
✅ Your homework
- Add the 9/21/55 EMA, VWAP and volume to a 5-minute chart on your platform (e.g., TradingView, thinkorswim, TradeStation or Webull).
- Find one support, one resistance and one flag on any ticker.
- Play the candle flash-card game until you can name each candle.
- Advanced: backtest the 9/21 EMA crossover before trading it live.
📎 Resources
- Candlestick & Candlestick Patterns guide (PDF, 12 pages)
- Candle flash-card game (thanks @Skittles)
- TradingView (charting and backtesting)
- ADT Academy: https://americandreamtradingacademy.com